A previous diary [1] described processing some local PCAP data with Zeek. This data was collected using tcpdump on a DShield Honeypot. When looking at the Zeek connection logs, the connection state information was unexpected. To help understand why, we will compare data from different locations on the network and process the data in a similar way. This will help narrow down where the discrepancies might be coming from, or at least where they are not coming from. Some initial factors considered:
- Differences in capture commands between pfsense and local honeypot
- Firewall placed between pfsense and honeypot
- Resource constraints on honeypot
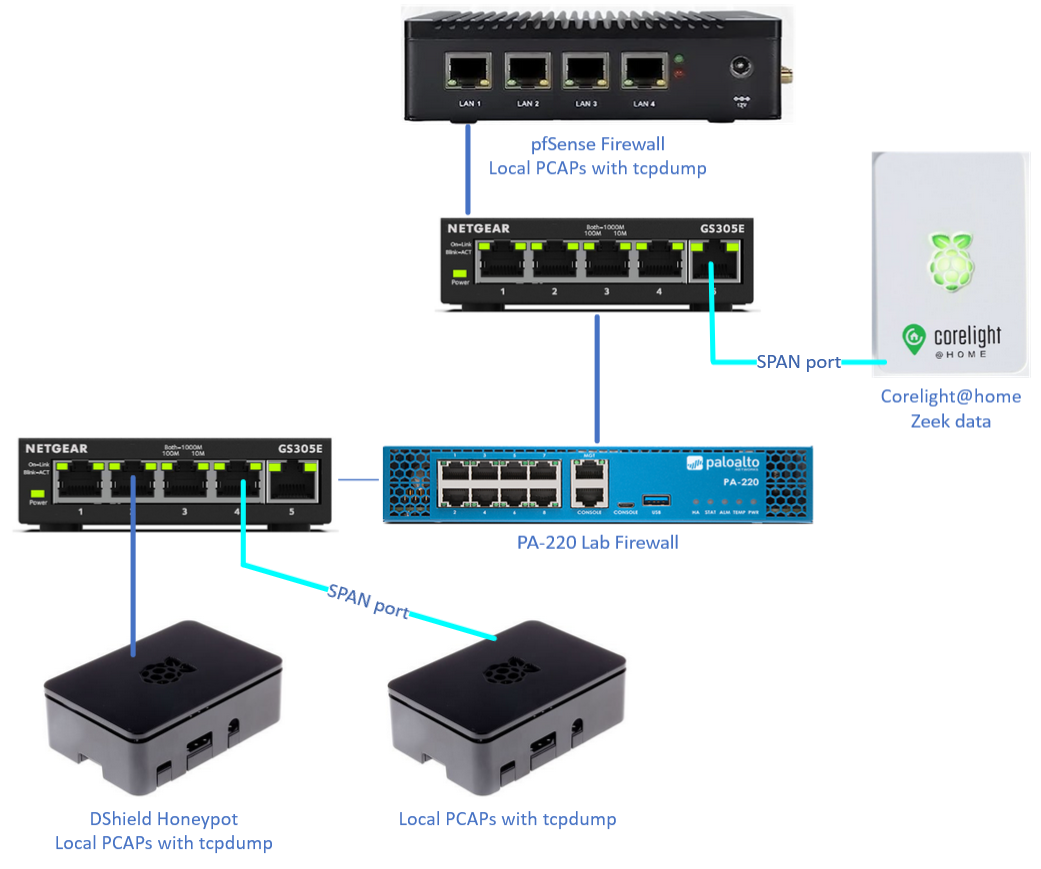
To start, let's take a look at a high level overview of the network and where data is collected.

Figure 1: Layout of network and PCAP/Zeek data capture points
There are four locations currently collecting some kind of network data that can be used for comparisons. To help with the investigation, I added a switch with a SPAN [2] port and another Raspberry Pi to collect PCAP data for the honeypot. Our data collectors:
- pfsense - full PCAP for any ingress or egress traffic from the network
- Corelight@home [3] - Zeek data collection for any ingress or egress traffic from the network using a SPAN port
- DShield Honeypot - full PCAP for any ingress or egress traffic from the honeypot
- External PCAP collector for honeypot - full PCAP for any ingress or egress traffic from the honeypot using a SPAN port
With all four collectors in place it was just a matter of waiting to collect data to compare. Once the data was collected, the data was processed to compare all the Zeek data in a similar fashion. This mean limiting the data to only what came to and from the honeypot in addition to a specific timeframe.
# due to having larger and multiple PCAPs, data for the pfsense needed to be merged into one file mergecap *.pcap* -w combined.pcap # tshark was used to extract data # # get data from 2/15/2023 6 AM - 12 PM (6 hours) # (frame.time >= "Feb 15, 2023 06:00:00") && (frame.time <= "Feb 15, 2023 12:00:00") # # get data to/from honeypot only # (ip.addr == 192.168.68.178) tshark -r "combined.pcap" -w extract.pcap -Y '(frame.time >= "Feb 15, 2023 06:00:00") \ && (frame.time <= "Feb 15, 2023 12:00:00") && (ip.addr == 192.168.68.178)' # process extracted data with Zeek /opt/zeek/bin/zeek -r extract.pcapWith the data collected and processed, all that's left is to compare the different data sources. First, we'll take a look at the different connection states seen in the Zeek logs. Note that the Corelight@home data is stored in JSON format so using the 'jq' utility will be of good use here.
# display unique connection states from Zeek logs and sort by count using zeek-cut cat conn.log | /opt/zeek/bin/zeek-cut conn_state | sort | uniq -c | sort -n # display unique connection states from Zeek logs and sort by count using jq # # process JSON data and select data with 'ts' between 2/15/23 6AM-12PM (UTC -6) # jq '(select(.ts >= "2023-02-15T12:00" and .ts <= "2023-02-15T18:00"))' # # process JSON data and select source or dest IP of honeypot (192.168.68.178) # jq '(select((."id.orig_h"=="192.168.68.178") or (."id.resp_h"=="192.168.68.178")))' # # process JSON data, select "conn_state" and sort by unique count # jq .conn_state | sort | uniq -c | sort -n cat conn_*.log | jq '(select(.ts >= "2023-02-15T12:00" and .ts <= "2023-02-15T18:00"))' | \ jq '(select((."id.orig_h"=="192.168.68.178") or (."id.resp_h"=="192.168.68.178")))' | \ jq .conn_state | sort | uniq -c | sort -n 
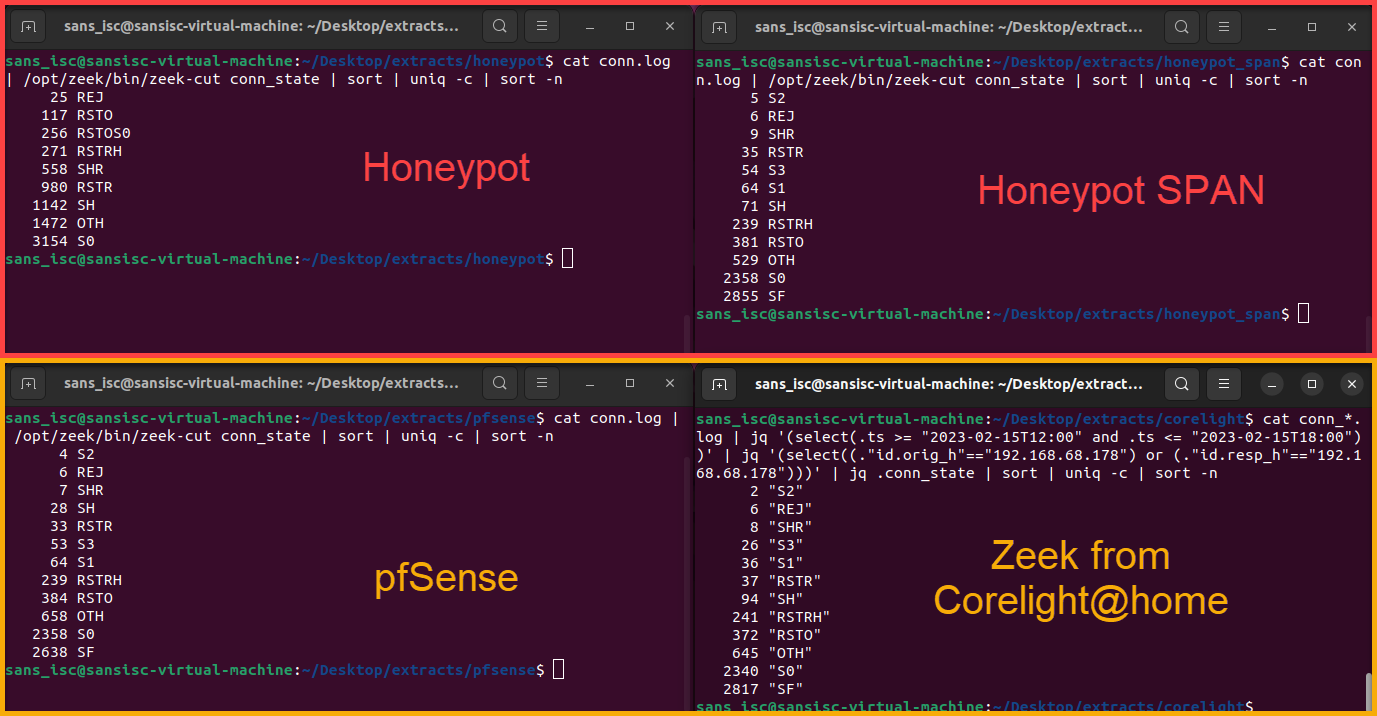
Figure 2: Comparison of four different network collection sources
| Connection State | Honeypot (Behind PA) | Honeypot SPAN | pfSense | Corelight@home |
| S2 | 0 | 5 | 4 | 2 |
| REJ | 25 | 6 | 6 | 6 |
| SHR | 558 | 9 | 7 | 8 |
| S3 | 0 | 54 | 53 | 26 |
| S1 | 0 | 64 | 64 | 36 |
| RSTR | 980 | 35 | 33 | 37 |
| SH | 1142 | 71 | 28 | 94 |
| RSTRH | 271 | 239 | 239 | 241 |
| RSTO | 117 | 381 | 384 | 372 |
| OTH | 1472 | 529 | 658 | 645 |
| S0 | 3154 | 2358 | 2358 | 2340 |
| SF | 0 | 2855 | 2638 | 2817 |
| RSTOS0 | 256 | 0 | 0 | 0 |
Reviewing the data within the connection states shows that a lot of the data for the locally generated PCAPs on the honeypot are outliers when comparing the other network data locations. There are some other deviations within the other three "non-outlier" datasets and some of these are likely due to other services running internally or directly on those collectors.
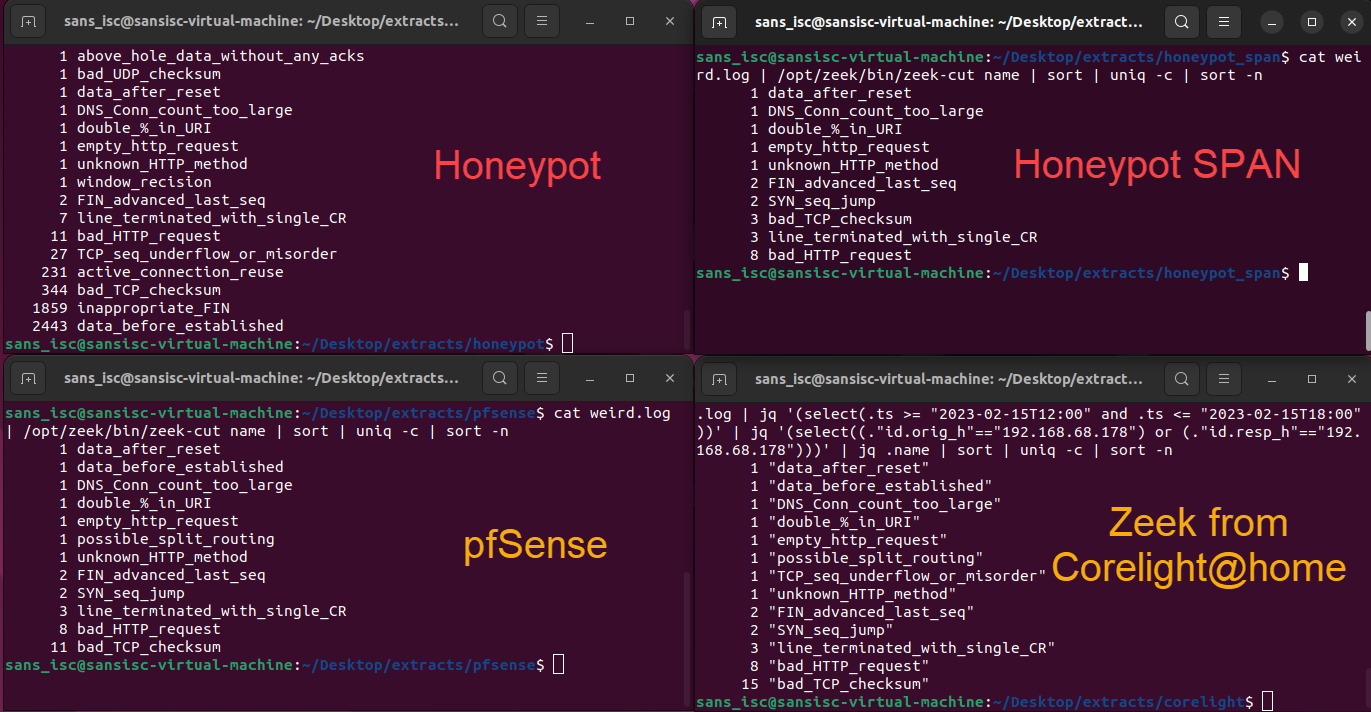
Comparing the 'Weird' [4] logs also shows some interesting differences.

Figure 3: Zeek 'weird' log comparisons between different network location data sources
Just as seen within the Zeek connection state data, the local honeypot PCAP data collection is very different than the other three sources. Depending on the analysis being done with the network captures, the location of where that network data is collected can make a difference. This has also helped inform the previous hypotheses:
- Being behind another hardware firewall did not seem to make a significant difference
- Command used to collect PCAP data did not seem to make a significant difference
- Both tcpdump commands used on the Raspberry Pis were set up exactly the same with a daily cron task
Some important factors to keep in mind when setting up network data collections:
- Understand the network topology
- Do not host network services on data collection devices
- Test data collections from multiple locations and compare
- Avoid collecting duplicate data
[1] https://isc.sans.edu/diary/PCAP+Data+Analysis+with+Zeek/29530/
[2] https://www.gigamon.com/resources/resource-library/white-paper/to-tap-or-to-span.html
[3] https://github.com/corelight/raspi-corelight
[4] https://zeek.org/2019/11/13/what-is-weird-in-zeek/#:~:text=The%20most%20intriguing%20exception%20may,to%20avoid%2Fconfuse%20a%20sensor.
--
Jesse La Grew
Handler
A previous diary [1] described processing some local PCAP data with Zeek. This data was collected using tcpdump on a DShield Honeypot. When looking at the Zeek connection logs, the connection state information was unexpected. To help understand why, we will compare data from different locations on the network and process the data in a similar way. This will help narrow down where the discrepancies might be coming from, or at least where they are not coming from. Some initial factors considered:
- Differences in capture commands between pfsense and local honeypot
- Firewall placed between pfsense and honeypot
- Resource constraints on honeypot
To start, let's take a look at a high level overview of the network and where data is collected.

Figure 1: Layout of network and PCAP/Zeek data capture points
There are four locations currently collecting some kind of network data that can be used for comparisons. To help with the investigation, I added a switch with a SPAN [2] port and another Raspberry Pi to collect PCAP data for the honeypot. Our data collectors:
- pfsense - full PCAP for any ingress or egress traffic from the network
- Corelight@home [3] - Zeek data collection for any ingress or egress traffic from the network using a SPAN port
- DShield Honeypot - full PCAP for any ingress or egress traffic from the honeypot
- External PCAP collector for honeypot - full PCAP for any ingress or egress traffic from the honeypot using a SPAN port
With all four collectors in place it was just a matter of waiting to collect data to compare. Once the data was collected, the data was processed to compare all the Zeek data in a similar fashion. This mean limiting the data to only what came to and from the honeypot in addition to a specific timeframe.
# due to having larger and multiple PCAPs, data for the pfsense needed to be merged into one file mergecap *.pcap* -w combined.pcap # tshark was used to extract data # # get data from 2/15/2023 6 AM - 12 PM (6 hours) # (frame.time >= "Feb 15, 2023 06:00:00") && (frame.time <= "Feb 15, 2023 12:00:00") # # get data to/from honeypot only # (ip.addr == 192.168.68.178) tshark -r "combined.pcap" -w extract.pcap -Y '(frame.time >= "Feb 15, 2023 06:00:00") \ && (frame.time <= "Feb 15, 2023 12:00:00") && (ip.addr == 192.168.68.178)' # process extracted data with Zeek /opt/zeek/bin/zeek -r extract.pcapWith the data collected and processed, all that's left is to compare the different data sources. First, we'll take a look at the different connection states seen in the Zeek logs. Note that the Corelight@home data is stored in JSON format so using the 'jq' utility will be of good use here.
# display unique connection states from Zeek logs and sort by count using zeek-cut cat conn.log | /opt/zeek/bin/zeek-cut conn_state | sort | uniq -c | sort -n # display unique connection states from Zeek logs and sort by count using jq # # process JSON data and select data with 'ts' between 2/15/23 6AM-12PM (UTC -6) # jq '(select(.ts >= "2023-02-15T12:00" and .ts <= "2023-02-15T18:00"))' # # process JSON data and select source or dest IP of honeypot (192.168.68.178) # jq '(select((."id.orig_h"=="192.168.68.178") or (."id.resp_h"=="192.168.68.178")))' # # process JSON data, select "conn_state" and sort by unique count # jq .conn_state | sort | uniq -c | sort -n cat conn_*.log | jq '(select(.ts >= "2023-02-15T12:00" and .ts <= "2023-02-15T18:00"))' | \ jq '(select((."id.orig_h"=="192.168.68.178") or (."id.resp_h"=="192.168.68.178")))' | \ jq .conn_state | sort | uniq -c | sort -n 
Figure 2: Comparison of four different network collection sources
| Connection State | Honeypot (Behind PA) | Honeypot SPAN | pfSense | Corelight@home |
| S2 | 0 | 5 | 4 | 2 |
| REJ | 25 | 6 | 6 | 6 |
| SHR | 558 | 9 | 7 | 8 |
| S3 | 0 | 54 | 53 | 26 |
| S1 | 0 | 64 | 64 | 36 |
| RSTR | 980 | 35 | 33 | 37 |
| SH | 1142 | 71 | 28 | 94 |
| RSTRH | 271 | 239 | 239 | 241 |
| RSTO | 117 | 381 | 384 | 372 |
| OTH | 1472 | 529 | 658 | 645 |
| S0 | 3154 | 2358 | 2358 | 2340 |
| SF | 0 | 2855 | 2638 | 2817 |
| RSTOS0 | 256 | 0 | 0 | 0 |
Reviewing the data within the connection states shows that a lot of the data for the locally generated PCAPs on the honeypot are outliers when comparing the other network data locations. There are some other deviations within the other three "non-outlier" datasets and some of these are likely due to other services running internally or directly on those collectors.
Comparing the 'Weird' [4] logs also shows some interesting differences.

Figure 3: Zeek 'weird' log comparisons between different network location data sources
Just as seen within the Zeek connection state data, the local honeypot PCAP data collection is very different than the other three sources. Depending on the analysis being done with the network captures, the location of where that network data is collected can make a difference. This has also helped inform the previous hypotheses:
- Being behind another hardware firewall did not seem to make a significant difference
- Command used to collect PCAP data did not seem to make a significant difference
- Both tcpdump commands used on the Raspberry Pis were set up exactly the same with a daily cron task
Some important factors to keep in mind when setting up network data collections:
- Understand the network topology
- Do not host network services on data collection devices
- Test data collections from multiple locations and compare
- Avoid collecting duplicate data
[1] https://isc.sans.edu/diary/PCAP+Data+Analysis+with+Zeek/29530/
[2] https://www.gigamon.com/resources/resource-library/white-paper/to-tap-or-to-span.html
[3] https://github.com/corelight/raspi-corelight
[4] https://zeek.org/2019/11/13/what-is-weird-in-zeek/#:~:text=The%20most%20intriguing%20exception%20may,to%20avoid%2Fconfuse%20a%20sensor.
--
Jesse La Grew
Handler

